Standard Temperature and Pressure Aviation Explained
Aug 03, 2026
Discover how standard temperature and pressure in aviation shape every flight you take. From altitude readings to engine performance, these baseline conditions defined by the International Standard Atmosphere are vital for safe, efficient flying.
Dive in to understand why pilots rely on these standards and how they impact your flight.
Quick Answer: What "Standard Temperature and Pressure" Mean in Aviation
In the world of aviation, STP is basically the same all over the world - its the International Standard Atmosphere (ISA) baseline, which is set at sea level with a temperature of 15 degrees Celsius that's 59 degrees Fahrenheit to US pilots. The air pressure here is 1013.25 HPA, or 29.92 inches of mercury and the air density is a respectable 1.225 kilograms per cubic meter.
These baseline numbers are what pilots, aircrew, student pilots, and aircraft enthusiasts alike use as a reference for calculating aircraft performance, checking their altimeter readings, and planning flights. Its the only way to make sense of these numbers the fact is we all need to start from the same place.
All that being said, real-world conditions rarely, if ever, match up with ISA exactly which is why understanding those little deviations is a huge part of everyday flying.
And lets be clear, its the difference between the temperature outside & what ISA says it should be, at any given altitude and that information is what helps pilots figure out how much runway you really need, how much climb you can do, and how much safety margin you've actually got.
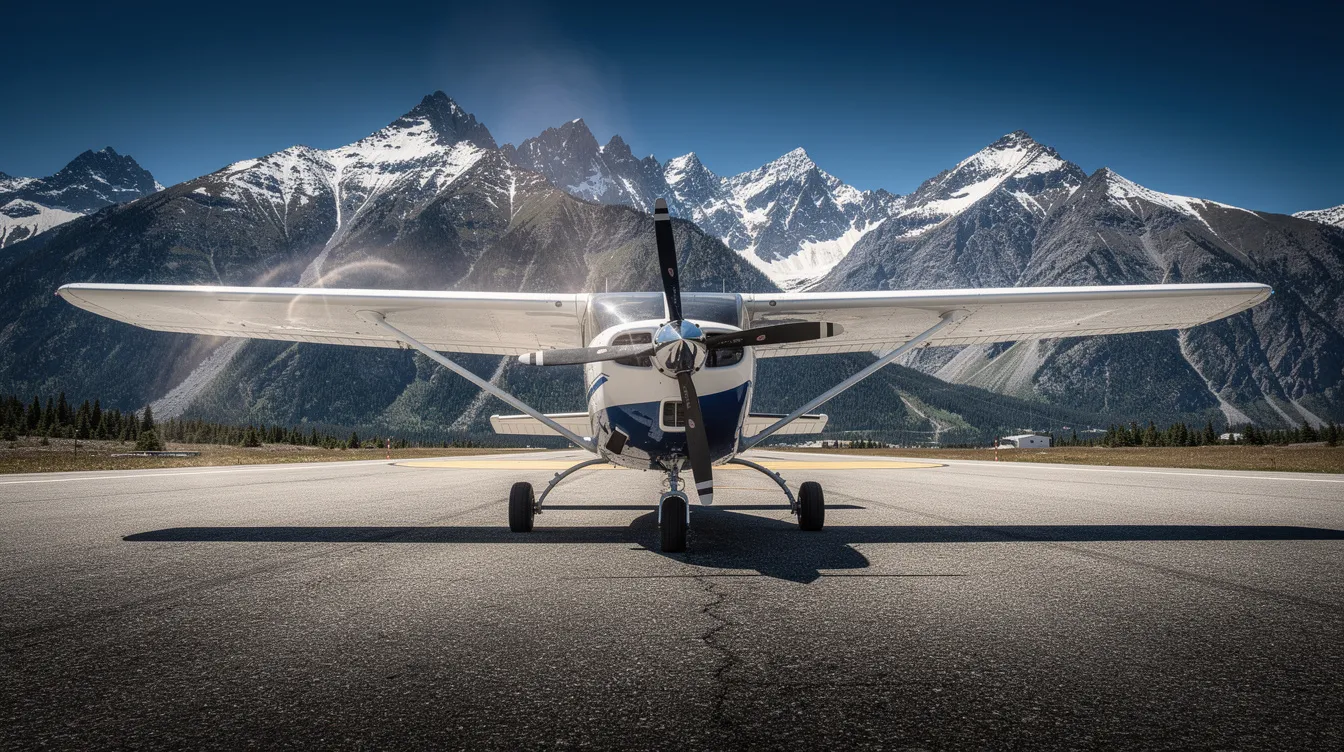
And trust me at a place like Telluride in Colorado on a hot afternoon, when the plane is already at a high altitude , the conditions can be a whole lot worse than STP would have you believe which can make even a routine takeoff a bit of a challenge.
The International Standard Atmosphere (ISA): Core Concept
The International Standard Atmosphere, also known as the ICAO standard atmosphere, is a globally agreed model describing how temperature and pressure change with altitude.
It gives engineers, regulators, and pilots one mathematical atmosphere to design aircraft against, calibrate instruments with, and publish performance charts from. ISA is used for performance and instrument calibration across the entire aviation industry.
At sea level, the standard atmosphere ISA defines these values:
-
Temperature: 15 °C (288.15 K)
-
Sea level pressure: 1013.25 hPa (29.92 inHg), which equals 101,325 pascals
-
Air density: 1.225 kg/m³
-
Speed of sound in dry air: approximately 340 m/s
ISA defines a temperature lapse rate of −6.5 °C per km - or about −2 °C per 1,000 ft from sea level up to roughly 11,000 m (approximately FL360). Above FL360, ISA assumes a constant temperature of −56.5 °C extending to about 20,000 m.
This profile closely resembles mid-latitude conditions, such as central Europe or the US mid-latitudes in spring, but it is a mathematical standard reference, not a weather report, so it does not account for real-world weather systems, moisture content, or water vapor.
Here is a concrete example: at 10,000 ft, ISA says the temperature should be about −5 °C. If the real air temperature is +10 °C, the temperature deviation is ISA+15. That gap has real consequences for how an aircraft performs.
Standard Temperature in Aviation: Values and Lapse Rate
Standard temperature is the ISA temperature expected at a given altitude, expressed in degrees Celsius for most aviation purposes. It starts at 15 °C at mean sea level, a fundamental concept explained in MSL in aviation, and decreases at the standard lapse rate of approximately 2 °C per 1,000 ft (often written as c per 1,000 ft in shorthand) up to about 36,000 ft.
A few quick examples make the pattern clear: at 3,000 ft, ISA temperature is about 9 °C; at 6,000 ft, about 3 °C; at 9,000 ft, about −3 °C; and at 18,000 ft, ISA temperature drops to approximately −21 °C. Each 1,000-ft step simply subtracts another ~2 °C from the baseline.
One thing to keep track of is ISA deviation, which is just the difference between the actual outside air temperature and the ISA temperature at that height. This gets written as ISA+ or ISA−. If the ISA chart is calling for 5 °C at your altitude, but your thermometer is saying 25 °C, then you're flying in ISA+20 conditions.
This is actually pretty important because performance charts in your POH will often assume ISA or show separate charts for ISA+10 °C and ISA+20 °C. Taking your actual outside air temperature and comparing it to the standard temperature at your altitude is the first step in understanding whether your plane is going to meet the numbers in the book, or fall short.
Standard Pressure: QNH, QNE, and Atmospheric Pressure Basics
Standard pressure in aviation is defined as 1013.25 hPa, or 29.92 inHg. It is the ISA sea-level pressure, the baseline for pressure altitude, and the standard datum plane a theoretical level or reference line from which that altitude is measured.
Pilots primarily use two altimeter settings when referencing altitude:
-
QNH is the current altimeter setting brought back down to sea level. If QNH is set, your altimeter will tell you how far above mean sea level you're flying. When the aircraft is parked on the ground, it should read roughly the same height as the airport’s field elevation.
-
QNE is the standard setting of 1013.25 hPa (29.92 inHg). Planes will usually use this setting above the transition level to make sure that both pilots and air traffic controllers are working with the same vertical reference points - based on flight levels.
As altitude increases, there is a predictable pressure decrease, so by around 18,000 feet the ambient pressure is about half of sea-level standard pressure.
In the United States, the transition altitude is 18,000 feet. Below that, pilots use the current local altimeter setting. Above 18,000 feet, they put the altimeter into standard pressure mode.
Using the wrong or an outdated altimeter setting can cause a huge discrepancy between the altitude that your altimeter shows, and the actual height of the aircraft.
This error can reduce the margin for error when it comes to terrain or obstacles in the air making sure you have the right altimeter setting is super important for safe flight.
Relation Between ISA, Standard Conditions, and Aircraft Performance
Aircraft performance think takeoff distance, rate of climb, cruise fuel flow and service ceiling is pretty much always published and given against the ISA standard conditions for the atmosphere.
When real-world atmospheric conditions deviate from ISA, changes in both temperature and pressure alter air density, affecting the performance of the engine, propeller, and wings. And [high temperatures] are only part of the picture: high humidity decreases air density too, further reducing performance.
Air density directly affects aircraft performance. High altitude and high temperature lead to lower air density, which means less oxygen for the engine and less lift from the wings.
Higher-than-standard temperatures and lower-than-standard pressures increase density altitude, and the result is predictable: longer takeoff rolls are needed if density altitude is higher than ISA, climb rates drop, and landing distances stretch.
A normally aspirated piston engine loses roughly 3% of rated horsepower per 1,000 ft of density altitude, so at 10,000 ft density altitude, you may have about 30% less power than at sea level.
Take this example: a fully loaded piston aircraft at a field elevation of 7,000 ft on a 30 degree C afternoon. ISA at 7,000 ft would call for about +1 degree C, so in reality you're flying in ISA+29 conditions. Density altitude jumps to 10,500 ft. Moist air can make those conditions even worse than the temperature-and-pressure example alone suggests.
Takeoff performance is gonna be 30-50% worse compared to normal conditions at sea level. The same runway on a cool 5 degree C morning (not far off ISA) and you'd be looking at a density altitude close to 7,000 ft still high, but manageable.
And just think that temp swing alone can be the difference between getting safely off the ground and having an aircraft that barely scrapes the trees.
High density altitude means you need more runway to get going and to land a fact that catches pilots off guard every summer at high elevations.
Performance charts in your plane's POH typically show curves for ISA, ISA+10, and ISA+20, or they just fold everything into a single density altitude input. Either way, the starting point is always: just how far are we from standard today?
ISA, Pressure Altitude, and Density Altitude: How They Connect
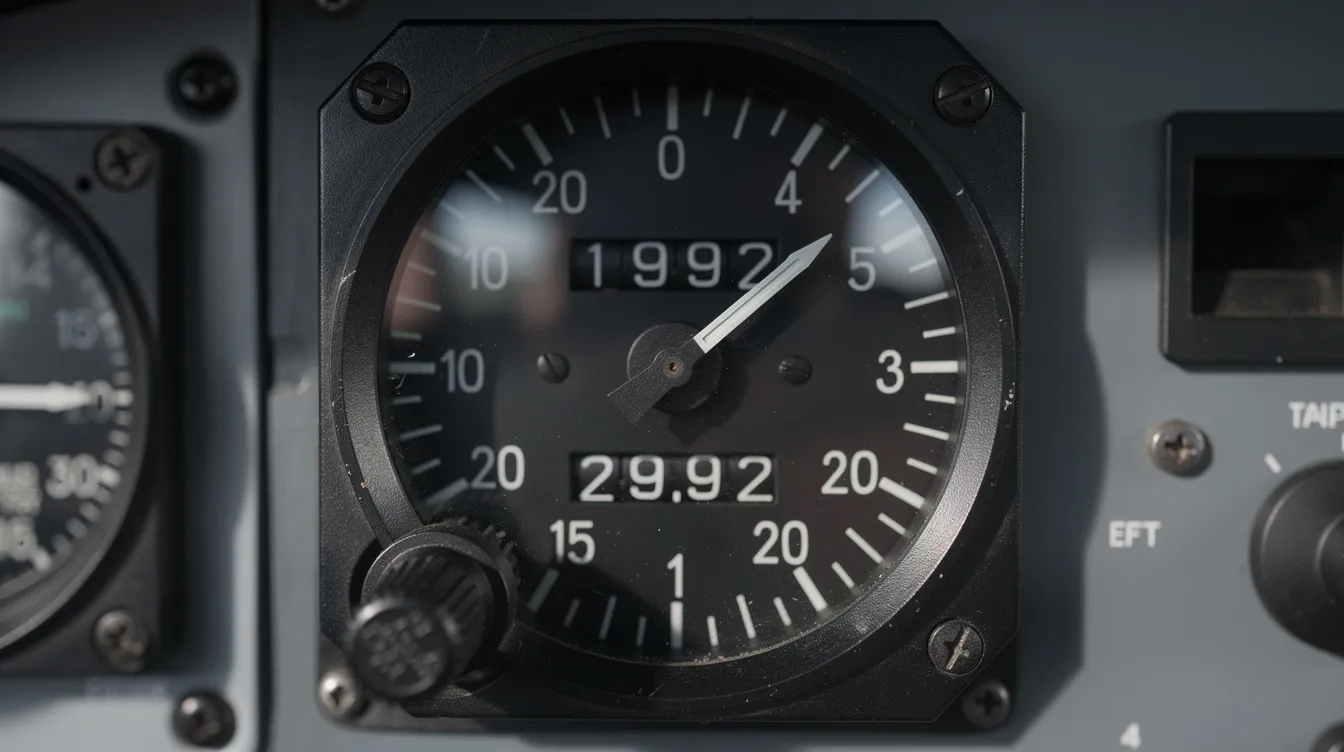
Pressure altitude is the height above the standard datum plane, which you can find by setting the altimeter to that standard 29.92 inHg (1013.25 hPa).
And when altimeters are set like this they give you a pretty theoretical reading of the altitude the aircraft is at in the ISA model, where the atmospheric pressure is the same as at the aircraft's actual position. That number is also the starting point for working out density altitude.
Density altitude is what you get when you correct the pressure altitude for any non standard temperatures and (if you like to get really technical) humidity levels. It effectively tells you the altitude in the ISA model where the air is as dense as it is where the aircraft is.
In simple terms, its the altitude at which the plane actually ends up operating, rather then the height at which it says its operating.
Under normal ISA conditions, pressure altitude and density altitude are the same, but as soon as the outside air temperature starts to rise above ISA, density altitude ends up creeping above the pressure altitude. And when the air starts to get a bit cooler than ISA then density altitude starts to dip below the pressure altitude.
A useful rule of thumb is:
Density altitude ≈ pressure altitude + (120 × ISA temperature deviation)
For example, suppose the altimeter indicates a pressure altitude of 5,200 ft with 29.92 inHg set. ISA temperature at that altitude is approximately 5°C, but the actual temperature is 25°C, producing an ISA deviation of +20°C.
5,200 + (120 × 20) = 7,600 ft
The aircraft will therefore perform approximately as though it were operating at 7,600 ft under standard ISA conditions. Understanding this relationship also helps pilots choose appropriate VFR cruising altitudes that account for real-world aircraft performance rather than relying solely on indicated altitude.

Standard Temperature and Pressure in Altimeter Use
An aneroid altimeter is calibrated to the International Standard Atmosphere (ISA) standard, based on the idea that temperature and pressure change with altitude at the same rate as the standard.
If the actual atmospheric conditions match the standard, the indicated altitude will give a pretty close idea of the aircraft's actual altitude. However, the altimeter only follows ISA assumptions, and the real atmospheric structure can shift with weather systems and temperature departures from standard.
In cold air, the atmosphere gets denser and heavier. As a result, true altitude is actually lower than what your altimeter says which means you end up flying higher than you think you are.
The phrase 'cold air you're lower than you think' is one that most pilots have at some point remembered. In contrast, when it's warmer than standard air, the true altitude will generally be higher than what your altimeter is telling you.
When you first reach the transition altitude pilots will switch their altimeters to the standard pressure setting of 29.92 inHg, or 1013.25 hPa. In the States this happens at and above 18,000 feet.
This means that all aircraft and air traffic control have the same vertical reference based on flight levels, even if local conditions are acting up. And that’s good for everyone pilots and ATC alike.
Standard Conditions, ISA Deviation, and Flight Planning
ISA is not just a textbook concept it drives the pre-flight planning sequence every time you fly. Here is what that looks like in practice.
Start by pulling up the METAR and TAF for your departure and destination. Compare the reported temperature and atmospheric pressure to ISA for the field elevation and your planned cruise altitude.
Determine the ISA deviation. Then compute pressure altitude and density altitude using a flight computer or the rule-of-thumb method.
These numbers shape real decisions. On days with high temperatures at high elevations, you may need to reduce payload or wait for cooler temperatures in the early morning, and performance planning should also consider moisture content.
If density altitude at your departure field exceeds the POH's demonstrated takeoff performance limits, picking a longer runway or a lower-elevation alternate is the smart move. At cruise, large ISA+ deviations at upper levels reduce engine efficiency and may push you toward a lower initial cruise level.
Here is a concrete example: a July afternoon in Denver (KDEN) with 32 °C OAT and QNH 30.05 inHg. Field elevation is 5,431 ft. Pressure altitude works out near 5,100 ft (slightly below field elevation because QNH is above standard).
ISA at 5,100 ft predicts about 5 °C. Actual OAT is 32 °C - ISA+27. Density altitude soars past 8,000 ft. If the air were unusually humid, which is less common in Denver than in some regions, performance would be worse than the dry-air assumption suggests. A pilot planning a departure in a normally aspirated single-engine aircraft should expect takeoff distance to increase substantially and climb rate to shrink.
Adjusting departure time to early morning, when air temperature drops closer to ISA, can cut density altitude by 2,000 ft or more.
Modern electronic flight bags and computerized flight planning tools use ISA as the internal baseline but require accurate input of actual temperature, QNH, and planned altitude. Garbage in, garbage out the tool only helps if the pilot feeds it real data.

Summary: Why Standard Temperature and Pressure Still Matter
Standard temperature (15 °C at sea level with a defined lapse rate) and standard pressure (1013.25 hPa / 29.92 inHg) form the backbone of the international standard atmosphere ISA model.
Every performance chart, altimeter calibration, and flight planning tool you use treats ISA as the starting point. ISA deviation and density altitude bridge the gap between that theoretical model and the real air outside your windscreen.
Three operational takeaways worth remembering
-
Always compare actual conditions to ISA before every flight, do not assume the book numbers apply without checking.
-
Always consider density altitude on hot or high-elevation days; when density altitude increases, takeoff performance and climb rate suffer.
-
Always respect cold-weather altimetry effects; in cold air, you are lower than your altimeter says, and obstacle clearance may be compromised.
Understanding standard temperature and pressure in aviation is not just exam material. It is what keeps you safe on a scorching afternoon at a mountain strip and on a frigid night descending through mountainous terrain.
Practice reading ISA tables, use your flight computer regularly, and work through sample problems until standard atmosphere concepts are second nature. The numbers never lie - as long as you know what they mean.
